


Cable One: Footprint Density
A look at CABO's footprint, focusing on what type of locations have seen increased fiber overlap and digging into their famous competitive advantage, low-density/rural footprint.

This post will look at Cable One’s footprint and the impact of fiber and fixed wireless competition. CABO 0.00%↑ is an interesting company to investigate because they’re seeing increased fiber overlap in some of their larger markets, their rural footprint is attractive to FWA (excess capacity if infrastructure is there), and CABO’s pricing strategy leaves them vulnerable to increased competition. They’re currently experiencing low/no growth in broadband subs (lost ~3k subs in 2023). I wrote up CABO in late 2022 (here) and it still holds up reasonably well if you’re looking for some more detailed background on the business.
Cable One passes ~2.8mn homes and provides broadband to ~1.1mn customers. ~75% of their customers are concentrated in 7 states: AZ, ID, MS, MO, OK, SC, and TX. MBI, which they currently own ~45% of (likely to own 100% by 2025), isn’t included in this analysis.

Largest Markets
CABO’s largest 2 largest markets are Gulf Coast, MS and Treasure Valley (Boise), ID. In a 2015 investor day they disclosed ~280k PSUs in these markets (PSUs include broadband, video, and voice); they’ve likely lost video and voice but gained broadband since 2015 — their overall internet penetration is up ~600bps. A rough estimate would be ~150-200k broadband customers total (~75-100k in each market), or ~15-20% of Cable One’s total broadband customers.
We’re going to investigate Gulfport, before looking at ~30 of CABO’s other markets.
Gulfport
The Gulfport-Biloxi CBSA (Core-Based Statistical Area) has a population of ~420k; if we assume ~2.5 people per household we’re looking at ~170k homes, implying ~45-60% penetration for CABO (based on my estimate above). This feels a little high but we’re not including businesses and urban areas tend to have higher overall internet penetration, so the lower end of this range is probably reasonable (~75k broadband customers in Gulfport).
Using the FCC Broadband Map, we can see how much fiber the CBSA has and how it’s evolved. The easiest way to do this is to go to the Area Summary and search by CBSA (Gulfport-Biloxi), and then use the service filters to select fiber. This will show you the fiber coverage for the CBSA you have selected (most recent data available is June 30, 2023); you can then toggle between different dates to see how availability has changed over time (can only go back to June 2022). For Gulfport, fiber was available across ~52% of the CBSA on June 30, 2023, up from ~37% on June 30, 2022.
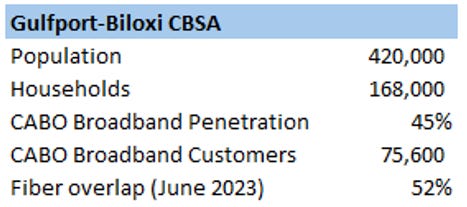
AT&T is the main overbuilder in Gulfport and their overlap is probably >55% now (Q1 24). This means CABO is competing against fiber across ~80-100k passings in the Gulfport-Biloxi CBSA (~3% of their ~2.8mn passings). A classic fiber overbuild gets ~15% penetration in year 1 and increases to ~35%+ by year 4. This would imply AT&T is going to have ~30k fiber customers in Gulfport in a few years; given CABO is the only other high-speed internet provider in the area, it’s reasonable to assume some will come from them.
This isn’t unusual, it’s well known CABO is experiencing more competition in some of their larger footprints, not a huge deal; other cablecos have shown there’s a blueprint to create a steady duopoly in this situation. Additionally, CABO’s competitive advantage is they have a rural focused footprint that discourages overbuilding. I agree rural is advantageous vs fiber, and CABO has ~half the fiber overlap of other cablecos like Charter and Comcast (~25% vs ~50%). I see two potential issues for CABO: FWA and pricing — we’ll get to these later, but first I want to investigate this competitive advantage, footprint density.
Density
To investigate CABO’s footprint density, I pulled the following data for >30 CBSA’s where Cable One operates: population, area size, and then fiber overlap in June 2023 vs June 2022. Before we get to the data, I acknowledge it isn’t perfect. Cable One does not provide coverage across every home in all the CBSA’s I’ve looked at and the broadband maps, while a reasonable representation overall, have inaccuracies; I still think we can make some informed conclusions from the data though — I included some well-known non-CABO footprints as a reference. It’s a busy table but I’ll summarize the findings below.
Note: I only considered an area covered by fiber if a provider offered >1000mbps downstream and >100mbps upstream.

The first thing to note is the data is ordered by highest to lowest density. As you’d expect, the denser footprints tend to have larger populations and more fiber overlap (with some exceptions). The CBSA’s above cover ~1.7mn households, and while CABO won’t pass every home in a CBSA, we’re probably still looking at >50% of CABO’s total homes passed in this analysis. My thoughts on the data:
Once the average population density gets >25km2, fiber overbuilders have been pretty active and appear to believe they can generate solid IRRs (mid-teens is usually their hurdle rate); overbuilds begin to slow once they cover >40% of a CBSA as denser locations are fiberized first (the 2nd half of a CBSA’s passings are less dense and less attractive).
CABO’s public statements regarding their fiber overlap appear reasonable; the last time they disclosed was early 2023 at ~25% — the 20% I have above likely understates the overlap as it includes all homes in a CBSA (both CABO and overbuilders likely haven’t built the most rural passings).
Boise has extremely low fiber overlap (~3%) and is a larger CABO market. This surprised me given reports Boise was being overbuilt by two companies (Lumen & Google); these announcements were made in 2023, so the buildouts weren’t substantially completed by June 2023 (latest date available for Broadband Map); Lumen has also slowed their overbuild cadence due to financial constraints.
Duncan, OK, a small town with a population of ~40k and low population density, saw fiber overlap increase from ~7-60%; this looks odd but it is due to an overbuild by a local fiber provider (Dobson), who has built out fiber in multiple small towns across OK and AR.
The Broadband map has Idaho Falls, ID, fiber overlap decreasing between June 2022 and June 2023… unlikely (dropped to ~9% from >60%). This is one of CABO’s top 5 footprints, per their 2015 investor day, so I searched some of the key zip codes on HighSpeedInternet.com; >60% of Idaho Falls has Quantum fiber available but at speeds up to 940mbps, below the 1000mbps I’m using as a proxy for fiber. I excluded them from the analysis, but my suspicion is Idaho Falls has a pretty high fiber overlap but doesn’t offer >1000mbps (Lumen likely overreported their speed for June 2022).
Unfortunately, I don’t think I’m breaking much news from this analysis, it showed what I (and probably you) thought it would. Fiber overlap is increasing, with buildouts focused on denser locations; I do think people underestimate how many of CABO’s customers come from their denser footprints though; if we assume ~35% penetration, population densities >60 km2 make up ~15-20% of their customers.
A population density of 60 km2 isn’t that dense (~4-5x less dense than Raleigh, NC for example), but these are the types of locations overbuilders are assessing with ~50% of the U.S. already overbuilt. We likely continue to see increased overlap in these footprints.
FWA
Prescott, AZ, a town where CABO connects ~30-35k homes with broadband (my est.), has basically no fiber overlap and is interesting for a few reasons. First, it appears fiber builders don’t see this as an attractive location; it has a low population density (~12km2), the terrain is not ideal (mountainous), and there’s been no material fiber activity per the FCC Map. Quantum fiber does have a presence there but from searching some addresses for availability, they don’t offer much FTTH— they’ll direct you to CenturyLink for a DSL option though!
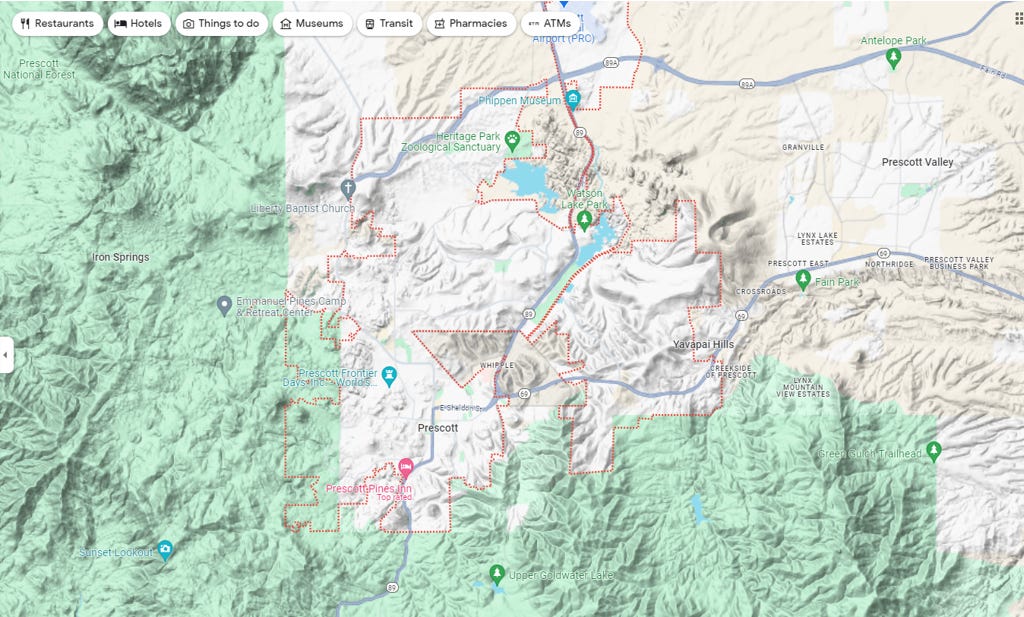
This is the type of location that might be attractive to fixed wireless providers. The terrain isn’t ideal, but a cable monopoly town with aggressive pricing and low fiber build risk is the type of area where they can add real value. I did some checks for Verizon & T-Mobile 5G home internet and there’s some availability, but it really depends on the specific address you search — most addresses I searched didn’t offer fixed wireless.
The issue for fixed wireless is spotty availability makes it difficult to attract customers, they need very targeted ad campaigns to target eligible homes. Additional investment to densify the network might make sense in this type of location — the economics could work if they can add enough broadband connections (possible given low fiber risk), and they’d get the added benefit of a higher quality wireless network. I think this is a longer-term trend to keep an eye on once core 5G buildouts slow.
Strategy
This is where the CABO bull thesis gets tough for me to understand. Their broadband ARPU, previously cheered by investors, is now a problem; it’s difficult to charge ~$85 (CABO’s current ARPU) when a household has another option, usually at ~$65-70. Even if you assume fiber overbuilders don’t compete on price (they just match CABO’s prices), overbuilders will just put higher ARPU’s in their models and more CABO towns become attractive to overbuild…
CABO’s defense of their ARPU is customers opt into higher tiers. I don’t think this argument holds much water; people don’t choose to pay $85 for the same broadband quality as other cablecos, they’re forced to because they go over the data caps (~700-1200mbps for CABO), or they need more speed. If fiber offers no data cap and higher speeds for ~$70, a lot of customers will be open to switching.
For locations that aren’t attractive to fiber, I think fixed wireless can be a real problem; demand has overshot even the most optimistic expectations and while it may take more time for rural locations to come online (and investment), a lot of customers are open to trying FWA if it saves them >$25 a month.
Final Word
This isn’t a full-blown thesis on Cable One (you can read my write up from 2022 here or updates from other quarters for full thoughts), but it was interesting to do some digging to see what type of locations CABO is seeing fiber activity in, even if it ended up roughly matching my expectations. This is also a useful blueprint to dig into other providers’ footprints if there’s another provider you’d like to investigate.